Consumables Calculation: How to Determine Daily Usage Correctly
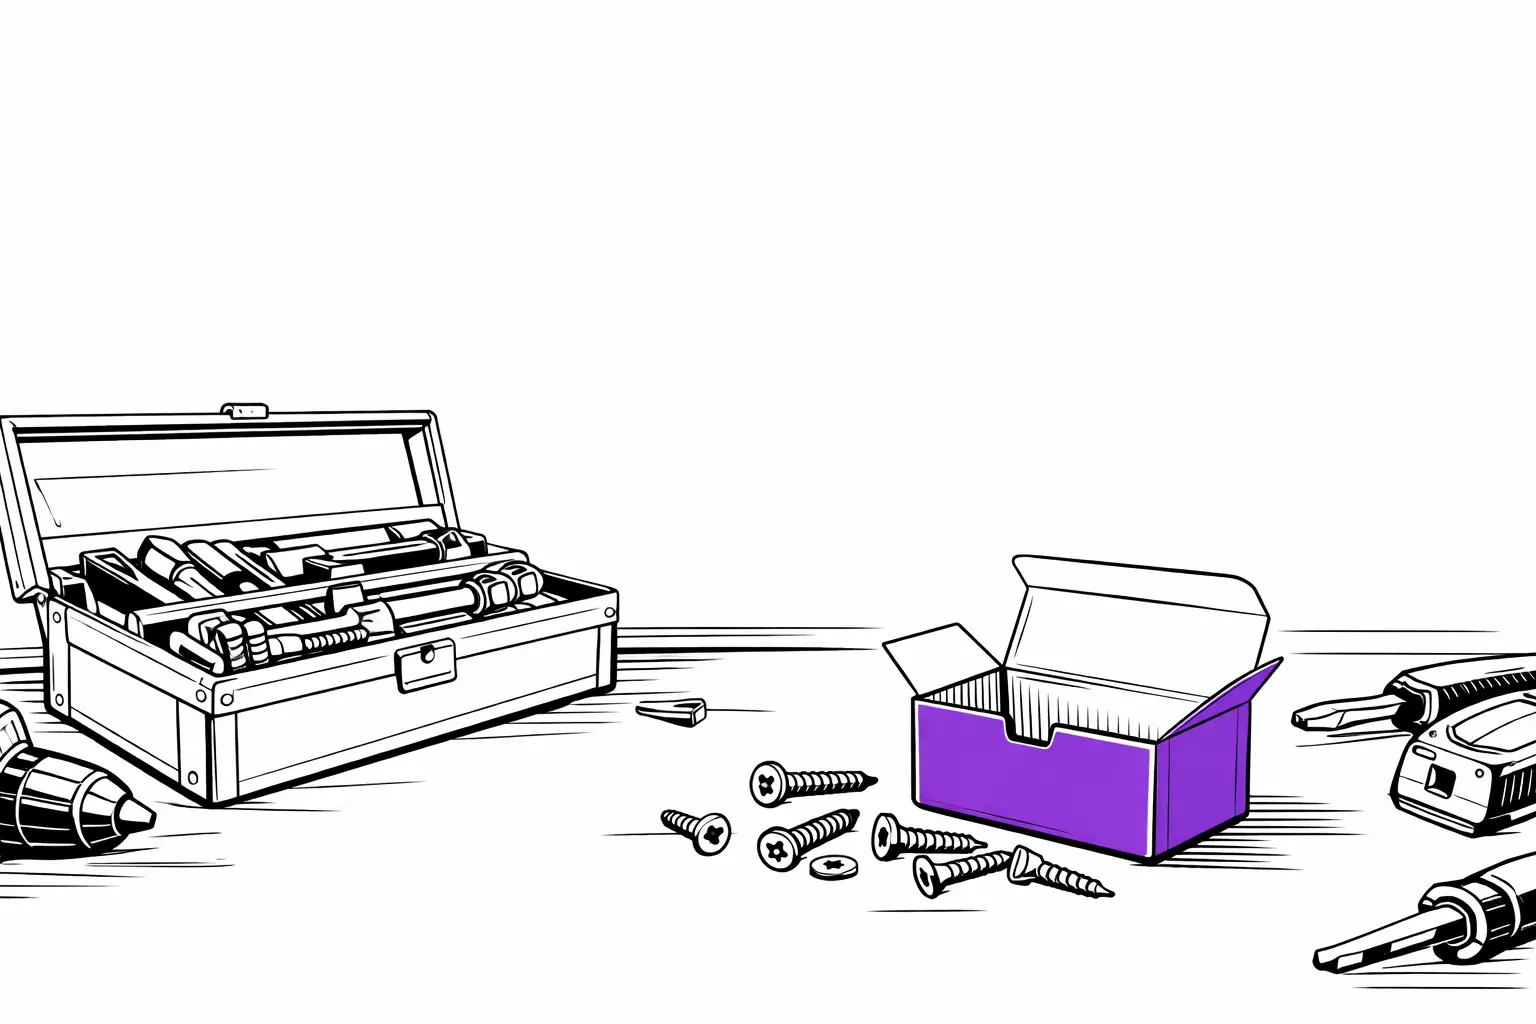
The box of screws is empty – right in the middle of a job. Now it’s: stop work, drive to the hardware store, lose time. If you know your daily usage, you reorder in time and avoid the stress.
TL;DR: Daily usage = total usage ÷ working days. With this number you calculate stock coverage and reorder point. Result: no more material shortages and no more unnecessary capital tied up in inventory.
Why usage calculation matters
According to a Lexware survey, 67% of SMEs report increased material costs. At the same time, a survey by the Chamber of Crafts Münster shows that 90% of businesses report problems sourcing materials, raw materials and intermediate products.
Tradespeople in HVAC and electrical spend an average of 7 hours per week on material procurement. Time that’s missing for billable work.
The problem: without a clear view of actual consumption, you end up swinging between two extremes:
- Ordering too little: stockouts, work stops, emergency trips to the hardware store or wholesaler
- Ordering too much: cash tied up, shelves full, material becomes obsolete
The solution starts with one number: daily usage.
What counts as consumables?
Before we calculate, a quick definition. According to Wikipedia, consumables are materials that are essential for the functionality of a device or for delivering a service and are regularly used up.
| Category | Examples | Note |
|---|---|---|
| Auxiliary materials | Screws, nails, wall plugs, adhesives, gaskets | Become part of the end product |
| Operating supplies | Lubricants, cleaners, gasoline, coolants | Are consumed, not part of the product |
| Office supplies | Paper, toner cartridges, labels | Needed for administration |
All of these materials have one thing in common: they are used up regularly and must be repurchased. That’s exactly where usage calculation comes in.
The core formula: calculate daily usage
The simplest formula for daily usage:
Daily usage = total usage in a period ÷ number of working days
Example: screws in an electrical business
- Usage in January: 500 screws
- Working days in January: 20
- Daily usage: 25 screws/day
With this number you can calculate:
- How long current stock will last (stock coverage)
- When you need to reorder (reorder point)
- How much buffer you need (safety stock)
Three methods to determine usage
Depending on business size and the data you have, different methods work better. Controllingportal explains these methods in detail.
1. Inventory method
The simplest method – perfect to get started:
Usage = opening stock + purchases – closing stock
Example:
- Opening stock (Jan 1): 200 screws
- Purchased in January: 400 screws
- Closing stock (Jan 31): 100 screws
- January usage: 500 screws
Best for: monthly or quarterly checks, small businesses without software
2. Retrograde method (back-calculation)
If you work with bills of materials, you can calculate backwards:
Usage = units produced × standard usage per unit
Carpentry example:
- 10 cabinets built
- Standard usage per cabinet: 80 screws
- Usage: 800 screws
Best for: businesses with standardized products or recurring job types
3. Perpetual inventory method
The most accurate method – every withdrawal is documented:
- Material withdrawal slip for each withdrawal
- Continuous stock updates
- Real-time overview
Best for: businesses with digital inventory management and a larger number of items
Recommendation: The perpetual inventory method provides the most accurate results and is the most commonly recommended in practice. But to get started, the inventory method is completely sufficient.
From daily usage to reorder timing
Daily usage alone doesn’t trigger automatic replenishment. For that you need three additional metrics.
Calculate stock coverage
Stock coverage shows how long your inventory will last at the current consumption rate:
Stock coverage (days) = current stock ÷ daily usage
Example:
- Current stock: 500 screws
- Daily usage: 25 screws
- Coverage: 20 working days
Define safety stock
Safety stock is your buffer for delivery delays or consumption spikes. Rule of thumb:
Safety stock = ⅓ × consumption during lead time
Example:
- Daily usage: 25 screws
- Lead time: 5 days
- Consumption during lead time: 125 screws
- Safety stock: approx. 40 screws
Calculate reorder point
The reorder point is the level at which you must reorder:
Reorder point = (daily usage × lead time) + safety stock
Example:
- Daily usage: 25 screws
- Lead time: 5 days
- Safety stock: 40 screws
- Reorder point: 165 screws
→ As soon as stock drops to 165 screws: reorder!
Practical example: HVAC business with 4 employees
A concrete calculation for O-rings:
| Parameter | Value | Calculation |
|---|---|---|
| Monthly usage | 400 pieces | (historical data) |
| Working days/month | 20 | |
| Daily usage | 20 pieces | 400 ÷ 20 |
| Current stock | 300 pieces | (inventory count) |
| Stock coverage | 15 days | 300 ÷ 20 |
| Lead time | 3 days | (supplier) |
| Consumption during lead time | 60 pieces | 20 × 3 |
| Safety stock | 20 pieces | 60 ÷ 3 |
| Reorder point | 80 pieces | (20 × 3) + 20 |
Result: You need to reorder when you reach 80 pieces. The current stock of 300 pieces will last another 15 working days.
Avoid the 5 most common mistakes
| Mistake | Consequence | Fix |
|---|---|---|
| Estimating instead of measuring | Wrong order quantities | Collect at least 3 months of real data |
| Ignoring fluctuations | Stockouts during peak periods | Adjust values seasonally |
| Safety buffer too large | Unnecessary capital tied up | Start with the ⅓ rule of thumb, then optimize |
| Underestimating lead time | Material missing despite ordering | Document real lead times and add buffer |
| Calculating once and never updating | Values become outdated | Quarterly review |
From Excel to automatic reordering
According to a ZDH/Bitkom study, only 12% of craft businesses use tracking systems for machines or operating equipment. A Handelskraft study shows that 70% use no industry software for procurement.
Getting started: an Excel sheet
For 20-50 items, a simple spreadsheet is enough:
- Item name
- Current stock
- Daily usage
- Reorder point
- Stock coverage (calculated)
Advanced: inventory management software
With 50+ items, software becomes more efficient:
- Automatic stock monitoring
- Reorder point alerts via email or push
- Automatic replenishment at defined thresholds
- Usage history and trends
A 4-step process for systematic usage management
Step 1: Identify your top 10
Which 10 items do you use most frequently? Start with those.
Step 2: Track for one month
For these items, keep a simple tally or spreadsheet:
- Date
- Withdrawal
- New stock level
Step 3: Calculate your metrics
After one month you have data for:
- Daily usage
- Stock coverage
- Reorder point
Step 4: Establish a routine
Choose a method:
- Manual: weekly check of your top 10
- Semi-automatic: Excel with warning colors when thresholds are reached
- Automatic: inventory software with automatic reordering
Conclusion: the one number that changes everything
Daily usage is the starting point for professional inventory management. With this one metric you can calculate:
- ✅ How long your stock will last
- ✅ When you need to reorder
- ✅ How much safety buffer you need
Start this week: pick 5 critical items and track usage. After one month, you’ll have the data foundation for better ordering decisions.
More on inventory management in our practical guide to min-max inventory management.
Ready for automatic orders?
repleno takes over usage monitoring for you. Reorder point reached? The order goes out automatically. → Learn more