Safety stock is your emergency buffer in the warehouse. The simplest formula: daily consumption x safety days. With 20 screws per day and a 2-day buffer, you need 40 units as your iron reserve. Without safety stock, any delivery delay leads directly to a stockout. Too much buffer ties up capital unnecessarily. This article covers four formulas, explains when each one fits, and works through examples from the trades.
Safety Stock Calculation: Formula, Example and Practical Tips for Trades
Safety stock calculation with formula, practical example for trade businesses and tips for supplier reliability, consumption fluctuation and day-to-day implementation.
Updated: 14 min read
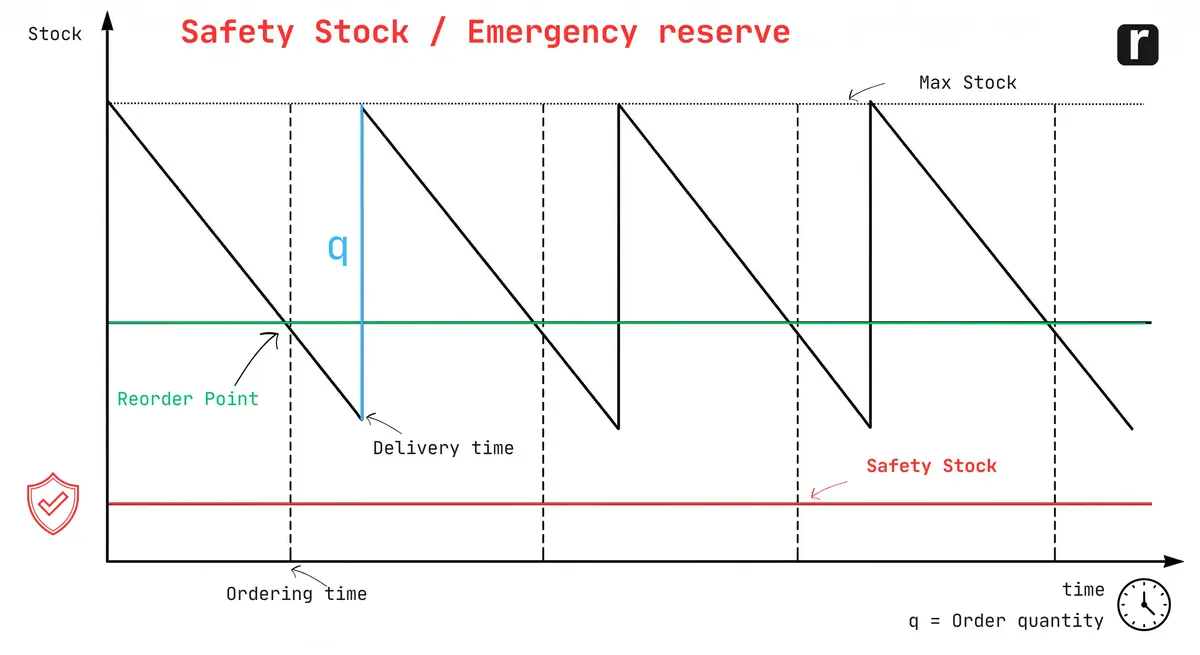
Table of contents
TL;DR
Wednesday afternoon. Your plumbing and heating business urgently needs press fittings for a job first thing tomorrow. The system shows 25 in stock. On the shelf: 8. The last delivery came three days late, and the stock level has never recovered since. The fittings are not enough. So: emergency order, express surcharge, and the hope that the wholesaler delivers by 6 AM.
The Institut der deutschen Wirtschaft measured this in 2023:
"Material shortages cause production delays averaging 2.3 working days per month at 38 percent of the small and medium-sized enterprises surveyed."
Source: Institut der deutschen Wirtschaft (IW Köln), SME and Supply Chains Study, 2023
In the trades, where jobs are planned to the day, every one of those days costs real money. In manufacturing, downtime costs per hour. In retail, an empty shelf costs customers. The problem is the same, only the context changes.
The cause is almost always the same: no calculated safety stock. Gut feeling instead. And gut feeling works fine until the first late delivery.
What Is Safety Stock?
Safety stock (also called minimum stock or iron reserve) is the quantity of material that must always be in the warehouse. It is your buffer for everything that can go wrong: delivery delays, unexpected spikes in consumption, damaged goods. When stock drops below the safety stock level, material is missing and work stops.
Three terms, one thing:
- Safety stock: The standard term in materials management
- Minimum stock: Often used interchangeably, especially in IHK exams and business practice
- Iron reserve: The vivid expression for the same value
In practice, all three mean the same thing: the stock that should never be touched. If it is touched, you have a problem that cannot be solved with a phone call.

Safety stock is just one of several inventory metrics that work together. Anyone who wants to calculate the reorder point needs safety stock as an input. And the maximum stock builds on safety stock in turn. The system only works when all values are correct.
The Simple Formula: Safety Stock With a Day Buffer
The fastest method for businesses that have a rough idea of their consumption but do not want to analyse statistical data:
Simple Formula (Day Buffer)
Safety Stock = Daily Consumption × Safety Days
Safety days are the number of days your business should be able to operate without a new delivery. Typically 1 to 3 days, depending on how reliable your supplier is.
Worked Example: Electrical Contractor With Cable Coils
An electrical contractor specialising in switchgear assembly with 6 employees installs H05V-K 0.75 mm² 100m cable coils every day. The figures:
- Daily consumption: 15 coils per working day (average over 6 weeks)
- Supplier delivery reliability: Delivery arrives on time in 80 percent of cases, occasionally 1 to 2 days late
- Safety days: 2 days buffer
Plugging in the numbers:
Safety Stock = 15 × 2 = 30 coils
Calculate safety stockThree formulas, daily consumption and lead time, find your buffer instantly.
As long as at least 30 cable coils are in the warehouse, the business can keep working even with a delivery delay of up to two days. If stock drops below 30, it gets tight.
And the reorder point? Assuming an actual lead time of 5 working days:
Reorder Point = 15 × 5 + 30 = 105 coils
As soon as stock drops to 105 coils, a reorder is placed. During the 5-day lead time, the business consumes 75 coils. That leaves 30 as buffer. This is how safety stock and reorder point connect.
Download reorder point Excel calculatorExcel tool with safety stock, daily consumption and lead time. All formulas pre-filled.
The One-Third Formula: General Practice Formula
Prof. Dr.-Ing. Bernd Noche calls it the general practice formula in his inventory planning lecture at the University of Duisburg-Essen: safety stock should equal one-third of consumption during the normal lead time.
General Practice Formula (Noche, UDE)
Safety Stock = 1/3 × (Daily Consumption × Lead Time)
Lead time covers everything from placing the order to receiving the goods: supplier processing time, production (if needed), transport and goods receipt inspection.
Worked Example: Plumbing Contractor With Press Fittings
A plumbing and heating contractor regularly orders V-profile press fittings 22mm. The baseline:
- Daily consumption: 8 units per working day
- Lead time: 12 working days (ordered from the manufacturer, not held in stock by the wholesaler)
Result:
Safety Stock = 1/3 × (8 × 12) = 1/3 × 96 = 32 units
32 press fittings as buffer. That covers roughly 4 days of consumption. For an item with a 12-day lead time, a realistic value.
For comparison, the simple formula with 2 safety days:
Safety Stock = 8 × 2 = 16 units
The one-third formula gives a higher value because it accounts for the full lead time, not just the estimated delay. For items with a long supply chain (manufacturer instead of wholesaler, import instead of domestic), the one-third formula is the better choice.
Special Case: Delay and Overconsumption at the Same Time
The one-third formula works with averages. Averages assume not everything goes wrong at once. When it does, the formula breaks down. Supplier late, consumption simultaneously higher than usual: that is not an exception, that is a normal month in a busy business. For this case:
Special Case: Delay and Overconsumption
SS = (LT × Overconsumption) + Delay × (Avg Consumption + Overconsumption)
An example: an electrical contractor expects a 5-day lead time for cable coils. The supplier is 2 days late. Simultaneously, a large project is running and consumption rises from 15 to 20 coils per day. That gives:
SS = (5 × 20) + 2 × (15 + 20) = 100 + 70 = 170 coils
For comparison: the simple one-third formula with normal consumption gives only 1/3 × (15 × 5) = 25 coils. That is the gap between planning and reality. This formula is for worst-case planning of critical items, not everyday use.
The Statistical Formula: For Businesses With Data
Businesses with sufficient consumption data (at least 8 to 12 weeks of daily withdrawals) can calculate safety stock more precisely. The statistical method accounts for how much consumption fluctuates:
Statistical Method (z-value)
Safety Stock = z-value × Standard Deviation × √Lead Time
The variables in detail:
- z-value (safety factor): Determines service level. At z = 1.65, you cover 95 percent of all fluctuations. At z = 1.28, it is 90 percent. For most trade businesses, a 95 percent service level is sufficient.
- Standard deviation: Measures how much your daily consumption fluctuates around the average. The more irregular the consumption, the higher the standard deviation, the more buffer you need.
- √Lead time: The square root of lead time in days. Longer lead times increase safety stock, but not linearly.
| Service Level | z-value | Meaning |
|---|---|---|
| 90% | 1.28 | 1 in 10 order cycles with stockout |
| 95% | 1.65 | 1 in 20 order cycles with stockout |
| 97.5% | 1.96 | 1 in 40 order cycles with stockout |
| 99% | 2.33 | 1 in 100 order cycles with stockout |
Worked Example: Metal Fabrication With Threaded Rods
A metal fabrication business uses M12 threaded rods in varying quantities depending on orders. Data over 10 weeks:
- Average daily consumption: 12 units
- Standard deviation: 4.5 units (strong fluctuation between quiet weeks and large orders)
- Lead time: 6 working days
- Target service level: 95 percent (z-value = 1.65)
With these values:
Safety Stock = 1.65 × 4.5 × √6 = 1.65 × 4.5 × 2.45 ≈ 19 units
For comparison:
- Simple formula (2 safety days): 12 × 2 = 24 units
- One-third formula: 1/3 × (12 × 6) = 24 units
- Statistical formula: 19 units
Here the statistical method gives the lowest value, because it measures actual fluctuation instead of applying a flat buffer. Less buffer = less tied-up capital = lower warehouse costs.
Calculating in Excel
For the statistical method in Excel:
- Enter daily consumption values in a column (e.g. A2:A50)
- Calculate standard deviation:
=STDEV.S(A2:A50) - z-value for 95% service level:
=NORM.S.INV(0.95)→ gives 1.645 - Formula:
=NORM.S.INV(0.95) * STDEV.S(A2:A50) * SQRT(LeadTime)
Round the result up. Safety stock is always a whole number.
The Average-Maximum Method: Worst Case Without Statistics
Businesses that do not analyse standard deviations but still want to capture peak loads use the average-maximum method. The formula:
Average-Maximum Method
Safety Stock = (Max Daily Consumption × Max LT) − (Avg Daily Consumption × Avg LT)
The logic: the formula calculates how much more material is needed in the worst case compared to the normal case. The difference is the buffer.
Worked Example: Timber Framing With Square Lumber
A timber framing business uses 8x8 cm square lumber. Project sizes fluctuate significantly, from small fit-outs to large roof structures. Figures from their own experience:
- Maximum daily consumption: 25 beams (large project running)
- Maximum lead time: 8 days (manufacturer in a supply shortage)
- Average daily consumption: 15 beams
- Average lead time: 5 days
This gives:
Safety Stock = (25 × 8) − (15 × 5) = 200 − 75 = 125 units
125 square lumber beams as buffer. That sounds like a lot, but it maps the real worst case: maximum consumption with maximum delivery delay.
This method sits in complexity between the one-third formula and the statistical method. You do not need a standard deviation, but you do need to know your peak values. If you know what your strongest quarter consumes and how long your supplier takes in the worst case, you have everything this formula needs.
Which Formula Fits Your Business?
Four formulas, one question: which one do I use? The answer depends on two factors: how many items do you manage, and how good is your consumption data?
| Situation | Recommendation | Why |
|---|---|---|
| Up to 30 items, rough consumption estimate | Day-buffer formula | Simple, fast, some buffer is always better than none |
| 30 to 100 items, known average consumption | One-third formula | General practice formula (Noche, UDE), accounts for lead time |
| Variable demand, fluctuating lead times, no statistics software | Average-Maximum formula | Accounts for worst case without statistical analysis |
| 100+ items, daily consumption data available | Statistical formula | Precise, saves capital through less overstock |
For most businesses with 20 to 80 regularly consumed items, the one-third formula is the right starting point: more accurate than a simple day buffer, without statistical analysis.
Download Excel templateAll four formulas pre-filled with example data. Enter your own numbers and read off the safety stock.
Any calculated number is better than gut feeling. Anyone who has no safety stock yet starts with the simple formula and refines later. Perfect data is not a prerequisite for starting, beginning matters more than perfection.
Four Factors That Determine Safety Stock
The formula gives a number. Whether that number is right depends on four factors you need to understand before you calculate:
1. Supplier Delivery Reliability
The most important factor. A supplier who delivers on time in 95 percent of cases requires less buffer than one with 70 percent reliability. But the delivery reliability in the catalogue is a marketing promise. Measure actual delivery reliability over 3 to 6 months. Count how often the delivery arrives on the agreed day. Anything below 90 percent means: more safety stock.
Simple to track: record the time between order date and goods receipt (from the delivery note).
2. Consumption Fluctuation
Steady consumption (15 units every day) requires less buffer than fluctuating consumption (5 on Monday, 30 on Tuesday). Seasonal businesses are particularly affected: heating installers consume three times as much material in winter as in summer. Safety stock must be higher in peak season than in the off-season.
Anyone who records their consumption for costing purposes already has the data. Anyone who does not: document withdrawals for 4 weeks, then calculate.
3. Item Criticality
Not every item needs the same buffer. The question is: what happens if this item is missing?
- A-items (stockout = operations halt): NYM cable for an electrician, press fittings for a plumber. A higher safety stock is worthwhile here.
- B-items (stockout = inconvenient but manageable): Cable ties, insulating tape. Important, but a day without is survivable.
- C-items (stockout = barely noticeable): Office supplies, cleaning products. Minimal or no safety stock needed.
Adjust the safety factor to the consequence of a missing part. For A-items: 2 to 3 safety days. For C-items, a rough estimate is enough.
| Item Class | Example | Recommended Formula | Safety Days |
|---|---|---|---|
| A-item (business-critical) | Press fittings, NYM cable | Statistical or Average-Maximum | 3 to 5 |
| B-item (important, manageable) | Cable ties, gaskets | One-third formula | 2 |
| C-item (non-critical) | Office supplies, cleaning products | Simple day-buffer formula | 1 |
Formula selection follows criticality, not the other way around.
4. Stock Accuracy
Stock accuracy means: the actual physical stock deviates from the system stock. In the trades, this happens constantly. Material is taken from open packs without being booked. Returns go back on the shelf (or not) without a system entry. Damaged goods remain counted as available even though they are unusable.
Every unit of deviation is a unit of false security. Anyone who believes they have 30 units in the warehouse, but only 22 are physically there, does not have 30 units of safety stock. They have 22, and the discrepancy only becomes apparent when it is too late.
Factor your business's typical stock accuracy into the safety stock. If 5 percent of stock is typically missing unbooked, add that 5 percent on top of the calculated safety stock for critical A-items. That is not a luxury buffer, it is compensation for the reality of the trades.
Adjusting Safety Stock Regularly
Safety stock is not a static value. Three situations require immediate recalculation:
Supplier change: New supplier = new delivery reliability = new buffer. Do not wait for the first stockout to reveal that the new supplier is less reliable than the old one.
Season change: Heating season starting? Consumption rising? Adjust safety stock for the affected items. Heating installers who do not increase safety stock for copper pipe in September are staring at empty shelves in November.
Order volume changes: Won a major contract? New framework agreement? Then daily consumption changes. And with it, safety stock.
As a minimum: check quarterly whether the values still fit. That takes 30 minutes for the 20 most important items. The alternative, an unplanned emergency run to the wholesaler, costs more.
The Stock System: Safety Stock, Reorder Point, Maximum Stock
Safety stock does not stand alone. It is part of a system of three metrics that work together:
| Metric | Formula | Function |
|---|---|---|
| Safety Stock | Daily Consumption × Safety Days | Emergency buffer |
| Reorder Point | Daily Consumption × Lead Time + Safety Stock | Trigger for reordering |
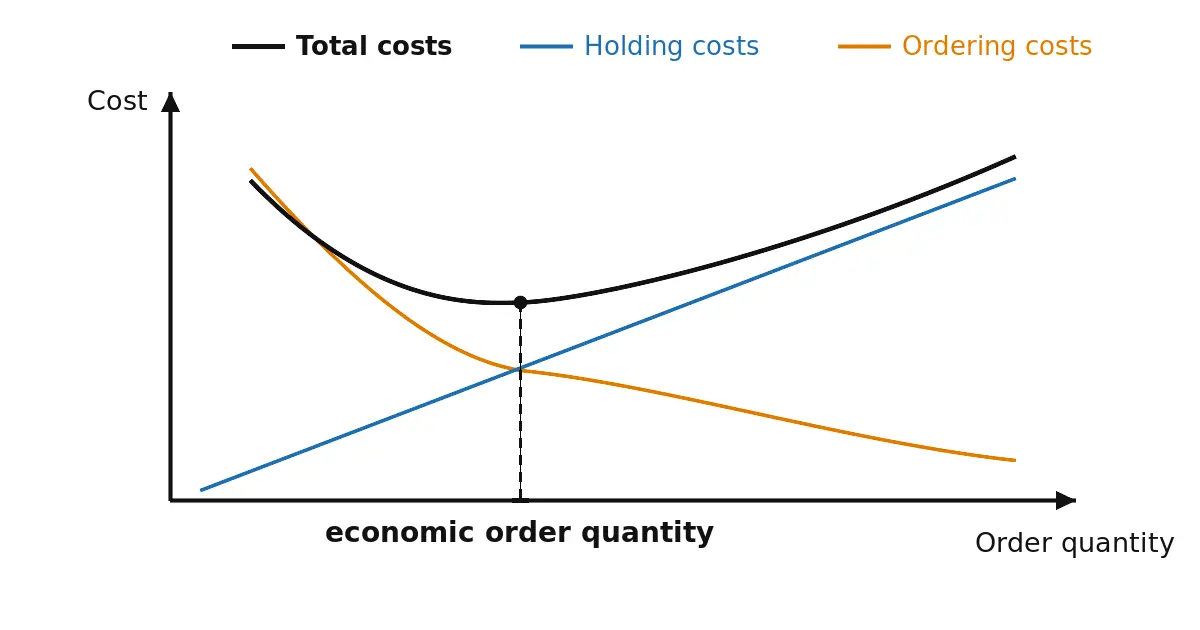
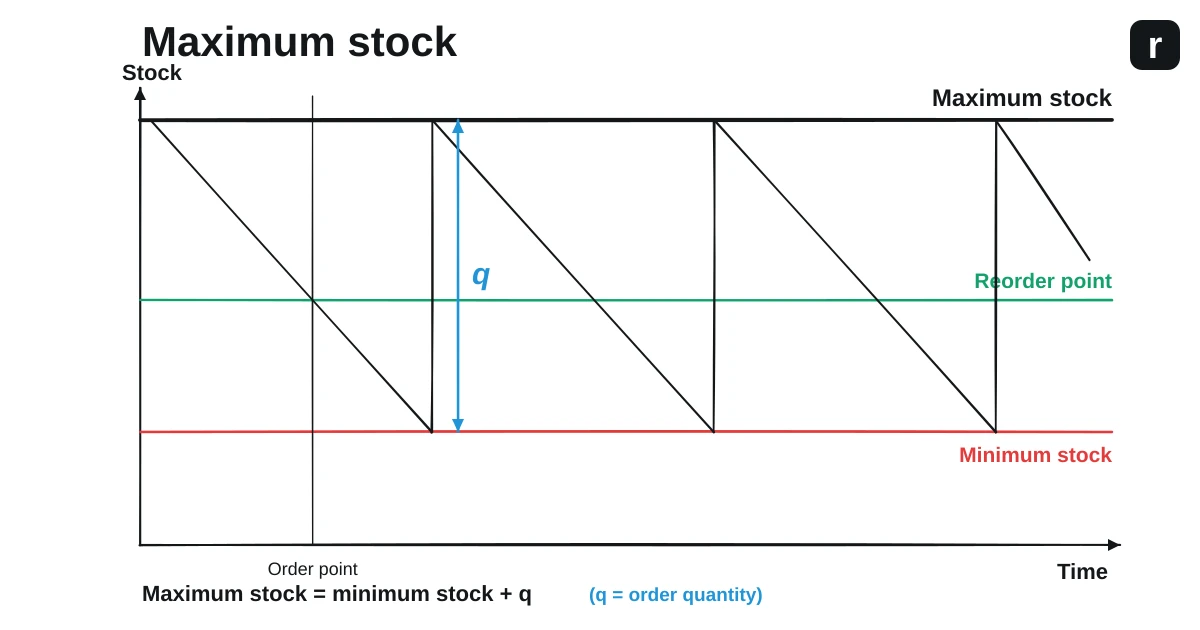
| Maximum Stock | Safety Stock + Optimal Order Quantity | Upper limit for storage space and tied-up capital |
How it works together: stock falls through daily consumption. When it reaches the reorder point, a new order is placed. During lead time, stock continues to fall until, on delivery, it sits just above the safety stock level. After delivery, it rises to maximum stock level. Then the cycle begins again.
Anyone who calculates safety stock incorrectly shifts all other metrics. Too low = reorder point too low = too late to order = stockout. Too high = reorder point too high = order too early = overstock and higher warehouse costs.
How the reorder point is calculated in detail and how the formulas work together in practice is covered in the reorder point article.
From Formula to Daily Practice
The formula is the easy part. Safety stock only delivers value if it is actually monitored in day-to-day operations.
Excel Spreadsheet (Manual)
For starters, a table is enough: item name, daily consumption, lead time, safety stock, reorder point. Works for 10 to 30 items. Problem: Excel does not alert you. You have to actively check. And spreadsheets that nobody maintains are worthless after two weeks. Anyone who wants to compare the pros and cons of Excel versus digital tools will find a side-by-side comparison there.
Inventory Software (Automatic)
Software monitors stock levels in real time and alerts you when safety stock is breached. Data stays current, consumption histories are recorded automatically, and safety stock can be set individually per item. Makes sense for businesses with more than 30 regularly consumed items.
Automatic Reordering
The most consistent step is automatic reordering: the system detects a breach of the reorder point and orders directly from the stored supplier. No manual step in between. Especially for C-parts (screws, small parts, consumables), this saves the most time day-to-day.
| Number of Items | Approach |
|---|---|
| Up to 30 items | Excel spreadsheet. Set it up once, check weekly. |
| 30 to 100 items | Inventory software. Excel becomes a maintenance burden nobody maintains. |
| 100+ items or critical A-parts | Automatic reordering. Manual is too slow and too error-prone here. |
What matters most: clear responsibility beats any tool. Define one person by name, not "the team", who owns the system and keeps it running. Without that, every system fails.
Calculate safety stockThree formulas, daily consumption and lead time, find your buffer instantly.
Conclusion: Safety Stock Is Not a Luxury
Anyone who calculates safety stock for their 10 to 20 most critical items and adjusts it quarterly prevents most unplanned stockouts. Not all of them. But the avoidable ones. And the avoidable ones are the most expensive, because they come back every month.
The next step: take your 5 most important consumables. For each: check daily consumption, verify lead time with your supplier, set safety days. Three numbers per item. In 15 minutes, you have a buffer that makes the difference between "job site stopped" and "material ready."
Anyone who wants to not just calculate safety stock but also monitor it automatically can skip manual stock checks entirely. The system raises the alarm before the buffer is touched. Fewer missing parts, fewer emergency runs, more time for the actual craft.
Frequently Asked Questions About Safety Stock
The simplest formula: safety stock = daily consumption x safety days. With 20 units of daily consumption and a 2-day buffer, that gives you 40 units. For more precise results, use the one-third formula (consumption x lead time / 3) or the statistical method with standard deviation. Which formula fits depends on the number of items and the data available.
repleno Founder
Christoph worked as an electronics technician in industry for five years and experienced firsthand how missing small parts can slow down processes. Later, as a project manager at P.S. Cooperation GmbH (Böllhoff Group), he introduced digital procurement processes for recurring parts at medium-sized companies and corporations. Today, he is building repleno to largely automate the procurement of consumables in small businesses.
Find out what AI says about repleno.
One click, and ChatGPT, Claude, Gemini or Perplexity give you their take.
All repleno features
Inventory Management with Barcode Scanner via App
Inventory management with barcode scanner via smartphone. Scan every withdrawal, keep stock up to date continuously. repleno turns every scan into a consumption signal - the basis for reliable stock and less searching around.
Stock Analysis: See Where Capital Is Tied Up
See in black and white which items tie up capital. Spot slow movers, reduce overstock, free up money.