Inventory coverage tells you, in days, how long your stock will last and when to reorder.
Measured in days: divide current stock by daily consumption, in euros or in units.
The number only means something against your lead time: coverage has to cover the replenishment time plus a buffer.
Example: 2,400 euros stock, 100 euros consumed per day = 24 days coverage. Comfortable at 3 days lead time, too tight at 4 weeks.
When coverage drops to lead time plus buffer, the reorder point is reached and the order is due.
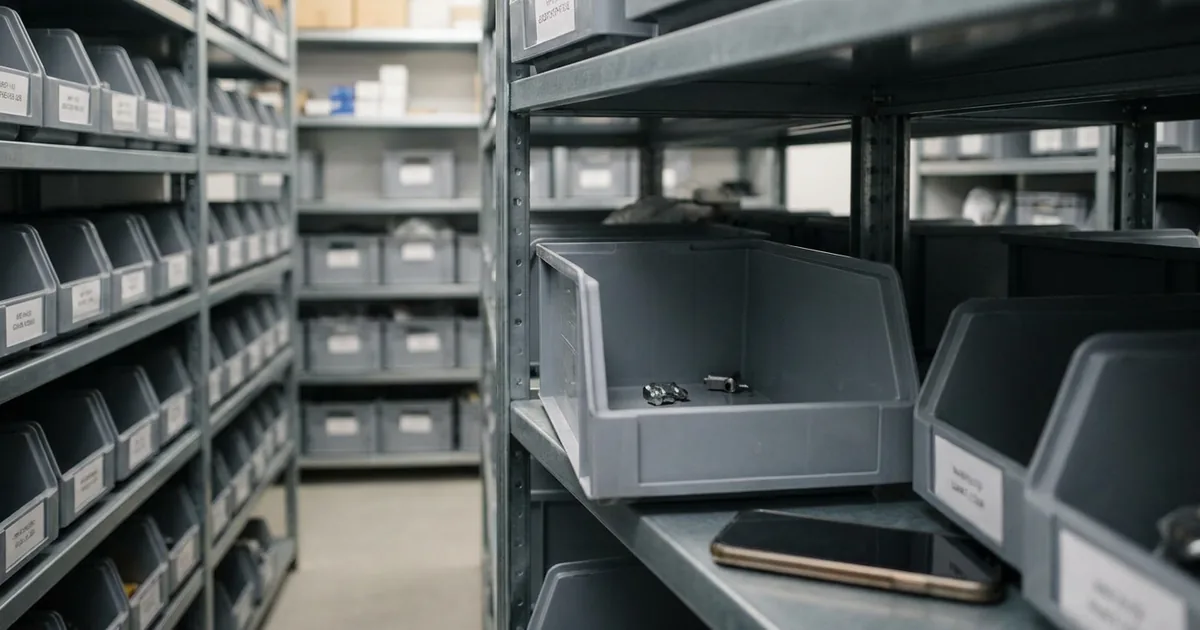
Friday afternoon, the last cable goes out. Is there enough left until the next delivery? Without a number in days, you order too early and tie up capital, or too late and the job waits on material. Inventory coverage gives you that number.
Calculating Inventory Coverage: Formula and Example
Coverage (some systems call it stock coverage) looks forward: as of today, it measures how long the current stock lasts at ongoing consumption. That makes it the metric for reorder planning.
Base formula
Inventory coverage = current stock / average daily consumption
You can calculate in units or in euros, depending on how you track your stock. Numerator and denominator have to belong to the same item: you get that item's daily consumption from its annual consumption divided by 365. If you count consumption and lead time in working days rather than calendar days, divide by working days here too.
Example in euros: An electrical business holds 2,400 euros of stock in one item. That item's annual cost of goods used is 36,500 euros, so 100 euros per day.
Beispiel
Stock 2,400 €, daily consumption 100 €
=Inventory coverage = 2,400 / 100 = 24 days
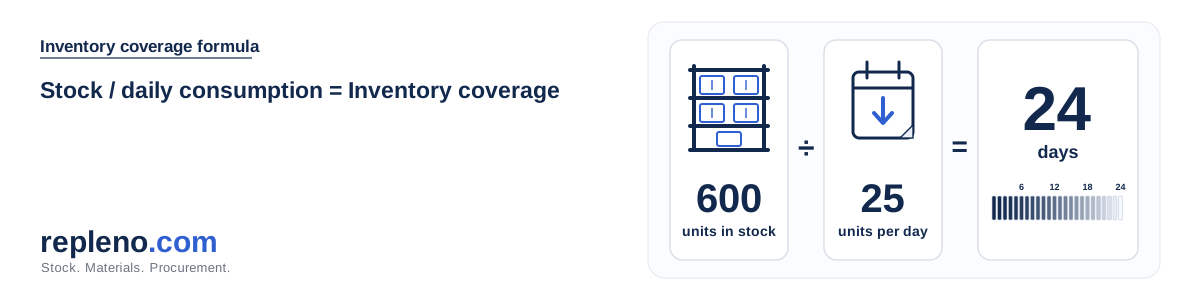
Example in units: 600 seals on the shelf, consumption 25 units per day.
Beispiel
600 seals, consumption 25 units per day
=Inventory coverage = 600 / 25 = 24 days
The stock lasts a good three weeks. But the math assumes reasonably steady consumption: for items that only go out per project or seasonally, the annual average distorts the coverage, and at zero consumption the formula divides by zero. Steer those items by the actual job, not by coverage.
Average or Current Stock: Which Formula Fits
Controlling glossaries often put the average stock in the numerator: opening plus closing stock of a period, divided by two. That variant looks back and evaluates a closed period, for quarterly or annual reporting. It helps little for reorder planning, because it smooths into a mean where you need today's level.
That is why the formula above uses the current stock as of today. It tells you how many days the stock still lasts now, and that steers the next order. Which one you pick comes down to one question: are you evaluating a past period or planning the next purchase.
What Is a Good Inventory Coverage?
Whether 24 days is a lot or a little depends on the lead time.
The same 24 days of coverage mean two different things:
At 3 days lead time: comfortable. You have three weeks of room for an order that arrives in three days.
At 4 weeks lead time: too tight. The stock runs out before the replenishment arrives.
There is a second limit at the top. A coverage of 180 days at three days lead time means: half a year of stock for an item you can get back in three days. That is a warning signal that asks for a reason. Sometimes a minimum order quantity, a season, or a project risk forces the stock. Absent such a reason, capital sits idle on the shelf here.
The reorder point turns this limit into a fixed rule: it marks the stock level where there is just enough left for lead time and buffer, and triggers the order there. Set this threshold once per item, and you no longer have to recalculate coverage every day. The automatic reorder places the order as soon as the stock reaches the threshold. If an order is already on the way, its quantity counts toward the stock: this planned coverage keeps the same item from being triggered a second time.
Inventory Coverage, Storage Duration, and Turnover: What Measures What
Metric
Direction
Question
Inventory coverage
forward
How long does the current stock last?
Storage duration
backward
How many days did an item sit on average before it was used?
Inventory turnover
year
How often does the stock turn over completely per year?
Coverage steers the next order, the other two evaluate how efficiently the stockroom worked in the past. Coverage and turnover are the same number from two sides: divide 365 by the turnover and you get the average coverage in days. All three belong to the inventory metrics a business uses to measure its stockroom.
Inventory Coverage in Excel
For a running overview, a table is enough. Four columns per item: current stock, annual consumption, lead time, coverage.
The formula in the coverage column, as an Excel table with named columns: =[@Stock]/([@AnnualConsumption]/365)
Sorting by bare coverage prioritizes wrong: an item with 10 days of coverage and 14 days of lead time is more urgent than one with 3 days of coverage that arrives tomorrow. So add a fifth column, coverage minus lead time, and sort by that ascending, and the items whose buffer runs out first sit at the top. Past roughly 500 items, keeping this by hand gets unreliable, and software watches the threshold per item instead.
Frequently Asked Questions About Inventory Coverage
Inventory coverage is current stock divided by average daily consumption. You get the daily consumption from annual consumption divided by 365. You can calculate in units or in euros, depending on how you track your stock.
A good inventory coverage covers the replenishment time plus a safety buffer. There is no fixed target: at three days lead time a few days of buffer are enough, at four weeks you need far more. Much higher coverage ties up capital sitting idle on the shelf.
Inventory coverage looks forward: it says how long the current stock lasts at ongoing consumption. Storage duration looks back: it says how many days an item sat on average before it was used. Coverage steers the order, storage duration evaluates the past.
Christoph worked as an electronics technician in industry for five years and saw how missing small parts slow down operations. Later, as a project manager at P.S. Cooperation GmbH (Böllhoff Group), he led system-supported C-parts logistics projects for mid-sized industrial and machine-building companies. Today, he is building repleno full-time, inventory management that helps small businesses detect demand early and automate reordering.